| 일 | 월 | 화 | 수 | 목 | 금 | 토 |
|---|---|---|---|---|---|---|
| 1 | 2 | 3 | 4 | |||
| 5 | 6 | 7 | 8 | 9 | 10 | 11 |
| 12 | 13 | 14 | 15 | 16 | 17 | 18 |
| 19 | 20 | 21 | 22 | 23 | 24 | 25 |
| 26 | 27 | 28 | 29 | 30 | 31 |
Tags
- M2M
- MSSQL
- 크롤링
- Serial
- sql developer
- 장고
- 티스토리 초대장
- 윈도우10
- django
- Visual Studio Code
- pymssql
- vscode
- MX Component
- rs485
- 자본주의
- 딥러닝
- PYTHON MSSQL
- scrapy
- 파이썬
- rs422
- windows10
- Python
- MSSQL PYTHON
- oracle
- tensorflow
- matplot
- 오라클
- c#
- MEAN Stack
- 텐서플로우
Archives
- Today
- Total
안까먹을라고 쓰는 블로그
[Python] 모두의 데이터분석 with 파이썬 - 코드2 (matplot) 본문

반응형
Matplotlib: Python plotting — Matplotlib 3.1.1 documentation
Matplotlib is a Python 2D plotting library which produces publication quality figures in a variety of hardcopy formats and interactive environments across platforms. Matplotlib can be used in Python scripts, the Python and IPython shells, the Jupyter noteb
matplotlib.org
스터디 소스코드
import matplotlib.pyplot as plt

plt.style.use('ggplot')
plt.scatter([1,2,3,4], [10,30,20,40])
plt.show()
import matplotlib.pyplot as plt

plt.scatter([1,2,3,4], [10,30,20,40], s = [100,200,250,300])
plt.show()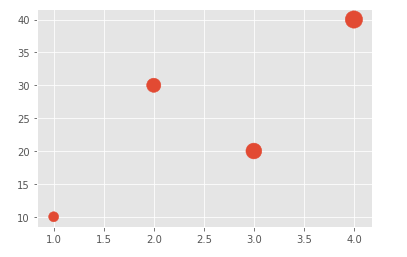
import matplotlib.pyplot as plt

plt.scatter([1,2,3,4], [10,30,20,40], s = [30,60,90,120], c = ['red', 'blue', 'green', 'gold'])
plt.show()
import matplotlib.pyplot as plt
plt.scatter([1,2,3,4], [10,30,20,40], s = [30,60,90,120], c = range(4))
plt.colorbar()
plt.show()
import matplotlib.pyplot as plt
plt.scatter([1,2,3,4], [10,30,20,40], s = [30,60,90,120], c = range(4), cmap = 'jet')
plt.colorbar()
plt.show()
import matplotlib.pyplot as plt
import random

x = []
y = []
size = []

for i in range(100):
    x.append(random.randint(50, 100))
    y.append(random.randint(50, 100))
    size.append(random.randint(10, 100))
plt.scatter(x, y, s = size, cmap = 'jet', alpha = 0.7)
plt.colorbar()
plt.show()
반응형
'Language > Python' 카테고리의 다른 글
| [Python과 텐서플로우를 활용한 딥러닝 기본 향상과정] 4일차 (0) | 2019.11.02 |
|---|---|
| [Python과 텐서플로우를 활용한 딥러닝 기본 향상과정] 3일차 (0) | 2019.10.26 |
| [Python] 모두의 데이터분석 with 파이썬 - 코드2 (인구통계데이터 + matplot) (1) | 2019.10.21 |
| [Python] 모두의 데이터분석 with 파이썬 - 코드1 (인구통계데이터 + matplot) (0) | 2019.10.21 |
| [Python] 모두의 데이터분석 with 파이썬 - 코드(기상데이터 + matplot) (0) | 2019.10.21 |
'Language/Python' Related Articles
more


Comments